


Flexible
Text And Graphics
Elements
Multiple Data Formats
Information
Timing Analysis Elements
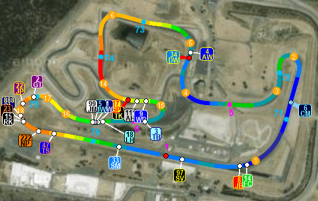
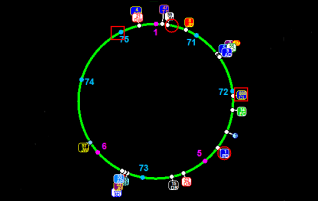
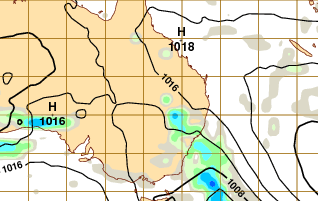
Track Animation
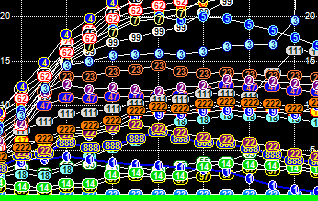
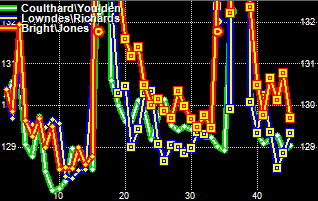
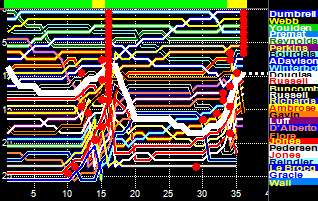
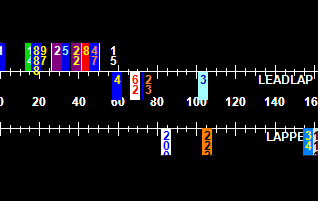
Trend: Race
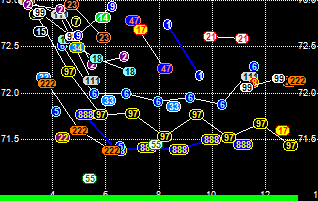
Trend: Prac/Qual
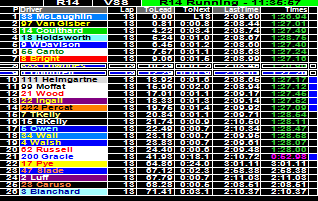
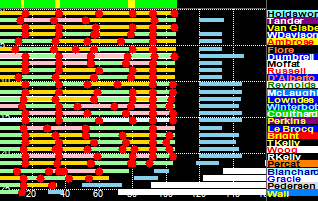
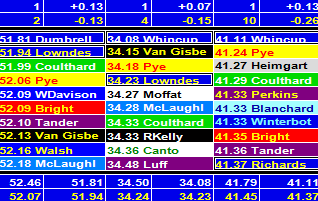
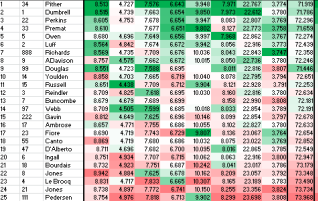
Leaderboard
Track Animation
Strategy: Race
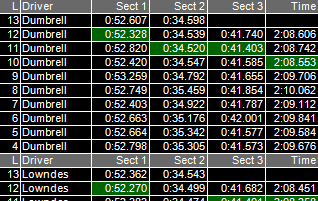
Lap History
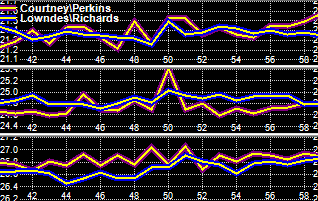
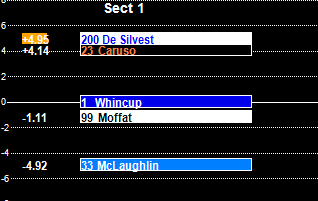
Sector History
Position: Race
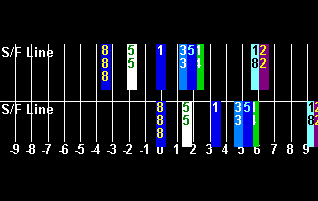
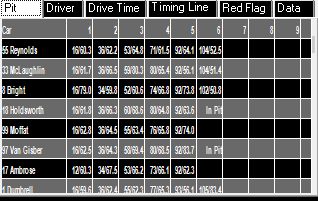
Main Sectors
Microsectors
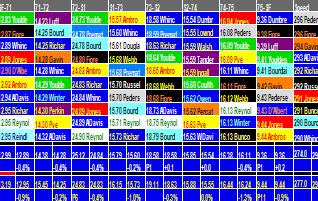
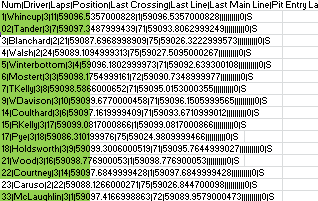
Sector History
Internet
Team Logo
Position: Race
Team Position: Race
Team Position: Race
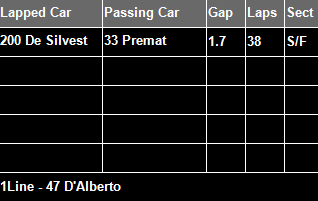
Blue Flag: Race
Statistics
Race Finish
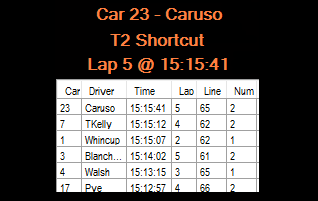
Off Track/Shortcut
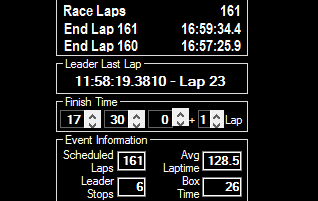
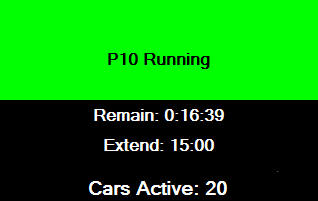
Event Status
Reports
Data Export
Timing Analysis Overview.
The Timing Analysis software receives the raw data provided by the event organiser (leaderboard updates, timing loop crossings, etc) and renders this as an array of statistical and graphic analysis elements, updated in real time.
This allows race engineers and strategists to have the information needed to understand the race, from an event level down to individual competitor performance and strategies.
Data is stored for later review, either post event or in preparation for later events at that venue.
The software operates in either race or practice/qualifying modes (with analysis elements specific to both), using either live or replay data.
Summary of features
- Utilizes organisers timing and scoring data feed
- Multiple display/analysis elements & templates
- User defined & switchable display templates
- Data saved for real time or fast replay & analysis
- Data and report export
- Track Map Formats - XY, GPS & MoTeC MT2
- Outright Position or Class display
- Microsoft Windows Compatible
- XP, Vista, Windows 7/8/8.1/10 (32 & 64 bit)
- Protocols supported
- Alkamel (Le Mans, +)
- Blancpain GT Series
- Natsoft (Supercars, Bathurst 12 Hr, Aust GT, +)
- RMonitor (MyLaps, IMSA, NASCAR, +)
- TeamStream (Creventic 24Hr Series, Asian Le Mans, +)
- TSL JTime (ICGT, Blancpain Asia, British GT, Sepang 12 Hr, +)
- WIGE (Nurburgring 24 Hour & VLN)
- Others upon request